Profiling Android Builds With Gradle Profiler

J
Hey! I’m Joe!
I’m an Android developer who is passionate about the human side of software development.
Search for a command to run...
No comments yet. Be the first to comment.
I've been a professional software developer in the mobile space for around 15 years now. I started in the Android 2.1 / Eclipse / Ant days and iOS Objective-C days pre-ARC on Xcode 4 (if memory servic

Intro I recently learned about friendPaths as part of the Kotlin Gradle Plugin while browsing an Android Slack group. From the documentation on friendPaths: "Paths to the output directories of the friend modules whose internal declarations should be ...

If you've ever tried to compare the behavior of Row in Google's Jetpack Compose, HStack in Apple's SwiftUi, and something like display: flex in the web world, you'll see some interesting results. First, let's take a look at how HStack renders two lon...

Said another way, how to supercharge your development workflow with a debug drawer. As Android developers, we're constantly looking for ways to streamline our workflow. One often-overlooked tool that

As Jetpack Compose becomes more widely used across Android (and Multiplatform projects!), detecting regressions via tooling becomes more important to shift left and detect regressions earlier in the d

If you're working on an Android project, you know that building your app can take a long time, especially as your codebase grows. Gradle is the build system that Android Studio uses, and it's responsible for compiling your code, generating your APK, and running tests. But when you're dealing with large projects, Gradle builds can become slow and frustrating.
That's where Gradle Profiler comes in. Gradle Profiler is a tool that can help you measure and analyze your Gradle builds, so you can identify bottlenecks and speed up your build times. In this post, we'll walk through how to install and use Gradle Profiler, and we'll show you how to use it to test different scenarios to optimize your build times.
The first step in using Gradle Profiler is to install it via SDKMAN. SDKMAN is a tool for managing software development kits, making it easy to install and manage Gradle Profiler.
To install SDKMAN on a Unix-based system, open up your terminal and run the following command:
curl -s "https://get.sdkman.io" | bash
Once you've installed SDKMAN, you can use it to install Gradle Profiler by running the following command (you may need to restart your terminal first):
sdk install gradleprofiler
Once you've installed Gradle Profiler, you can start using it to analyze your builds. To do this, you'll first create a .scenarios file. This is where you will define the different scenarios you want to profile. A sample profiling.scenarios file might look like this:
AssembleDebug8G {
    title = "assembleDebug with 8 gigs"
    tasks = ["assembleDebug"]
    warm-ups: 2
    iterations: 5
    cleanup-tasks = ["clean"]
    jvm-args = ["-Xmx8g", "-XX:MaxPermSize=1024m", "-XX:+HeapDumpOnOutOfMemoryError", "-XX:+UseParallelGC"]
}

AssembleDebug6G {
    title = "assembleDebug with 6 gigs"
    tasks = ["assembleDebug"]
    warm-ups: 2
    iterations: 5
    cleanup-tasks = ["clean"]
    jvm-args = ["-Xmx6g", "-XX:MaxPermSize=1024m", "-XX:+HeapDumpOnOutOfMemoryError", "-XX:+UseParallelGC"]
}

AssembleDebugParallel {
    title = "assembleDebug with 8 gigs and gradle parallel execution"
    tasks = ["assembleDebug"]
    warm-ups: 2
    iterations: 5
    gradle-args = ["--parallel"]
    cleanup-tasks = ["clean"]
    jvm-args = ["-Xmx8g", "-XX:MaxPermSize=1024m", "-XX:+HeapDumpOnOutOfMemoryError", "-XX:+UseParallelGC"]
}
3 different scenarios are defined in this file, all centered around the assembleDebug Gradle task. One with 8 gigs to the JVM args, one with 6 gigs, and one enabling Gradle parallel execution. We have also defined some additional information like the number of warm-ups and iterations to go through, as well as some clean-up tasks. Full documentation can be found on the Gradle Profiler Github.
To now execute one of these scenarios, we can use the following command in the terminal (assuming the file created above is in the root directory of your project and named profiling.scenarios). With the following command, we are running the AssembleDebug6G scenario that we defined earlier.
gradle-profiler --benchmark --project-dir . --scenario-file profiling.scenarios AssembleDebug6G
Note - You may want to add the following to your .gitignore
/profile-out/
/profile-out-*/
/gradle-user-home/
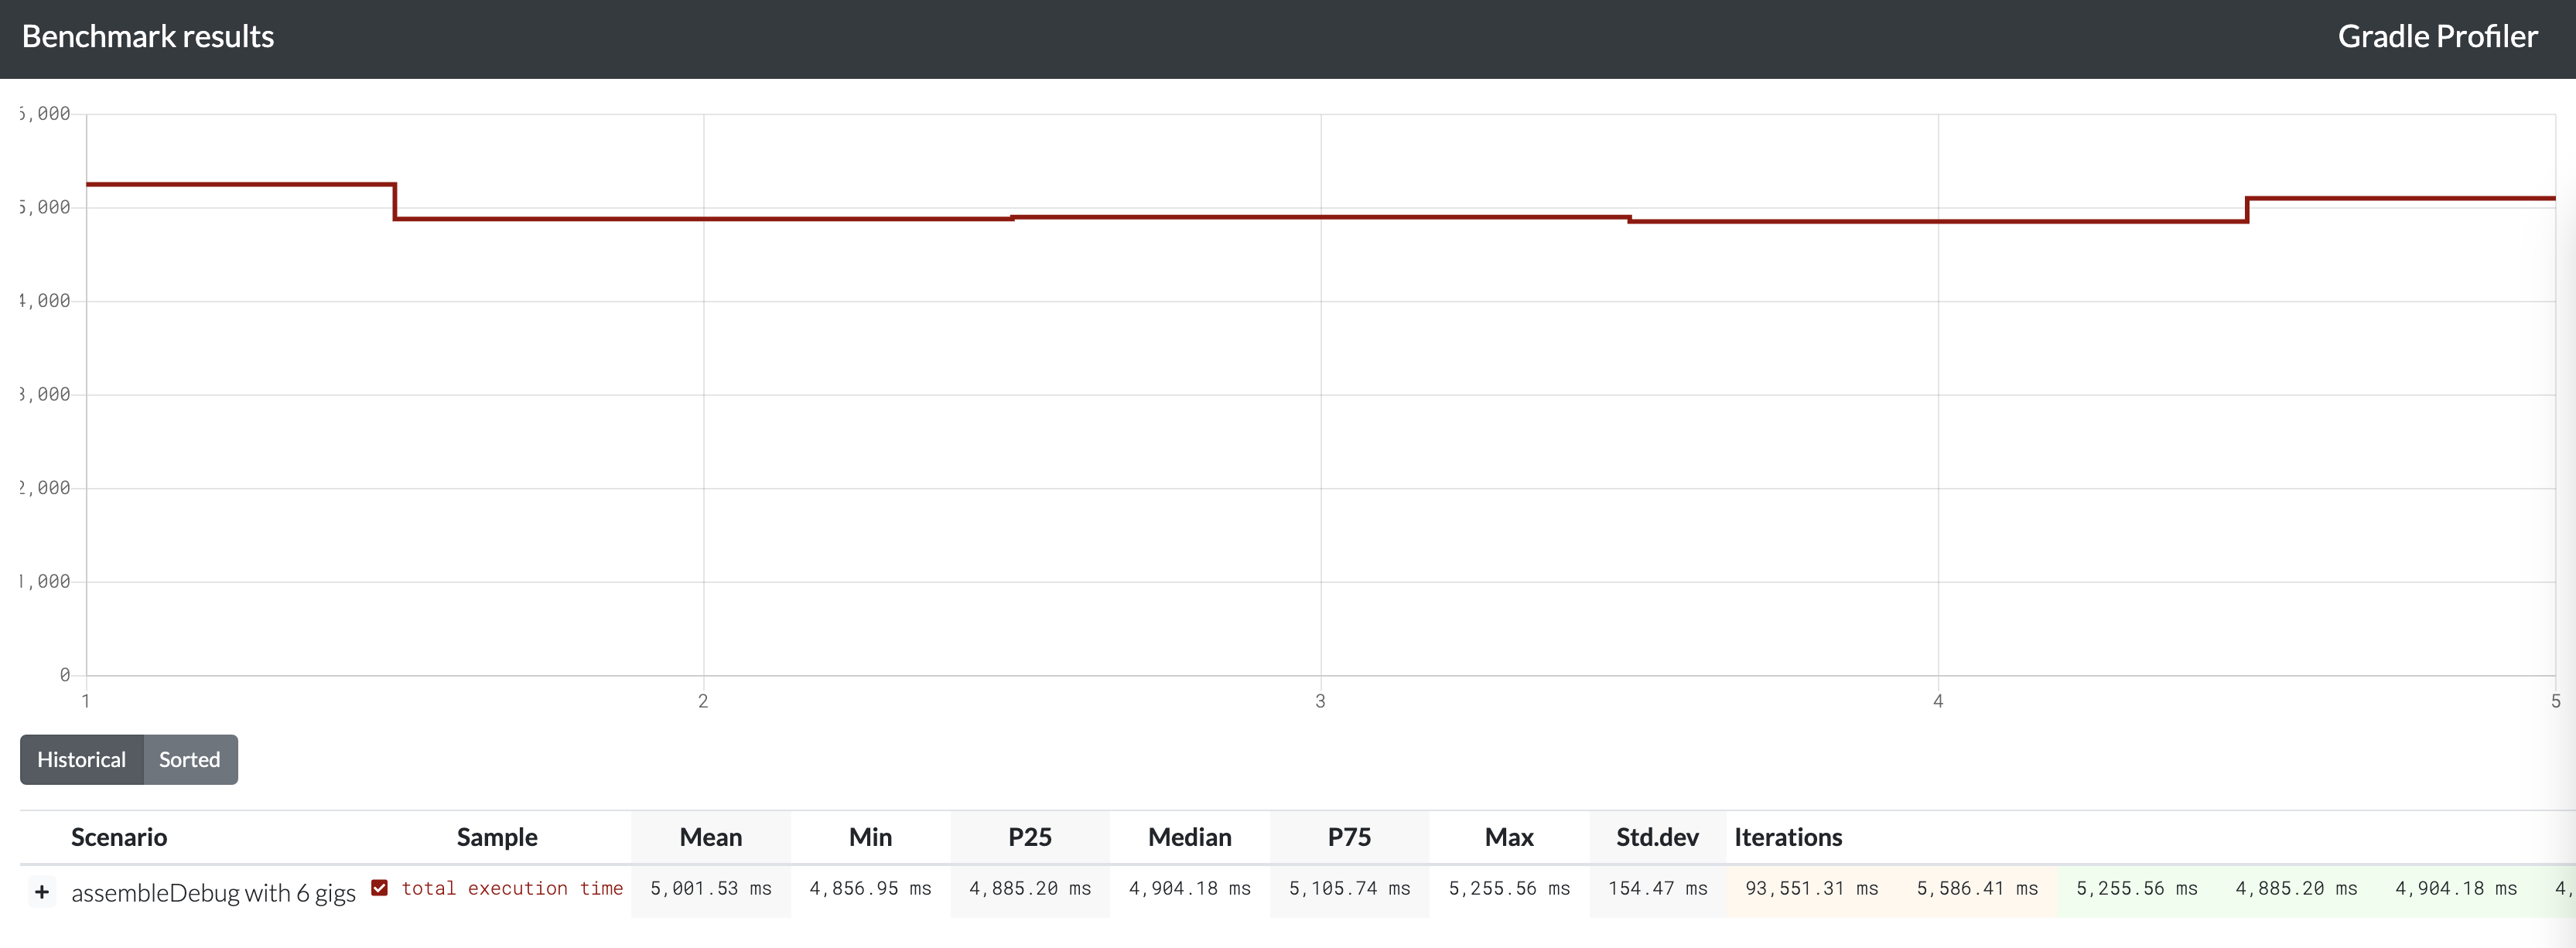
Once your build has been completed, Gradle will generate a report file that contains all of the information that was collected during the build. With the command above, this report file is saved in the root directory of your project.

To analyze the report, we can open up the .html file found in profile-out in this example. In this report, we can see fields like the mean, median, 25th, and 75th percentiles as well as the runtimes of each iteration.
Now that you've got Gradle Profiler set up, you can start testing different scenarios to see how they affect your build times. One common scenario that you might want to test is increasing the JVM args to see if that helps speed up your build.
To test this scenario, we can instead run the AssembleDebug8G scenario that we defined earlier. This will increase the maximum heap size that Gradle is allowed to use during the build, which can help speed up the build by reducing the amount of time spent on garbage collecting.
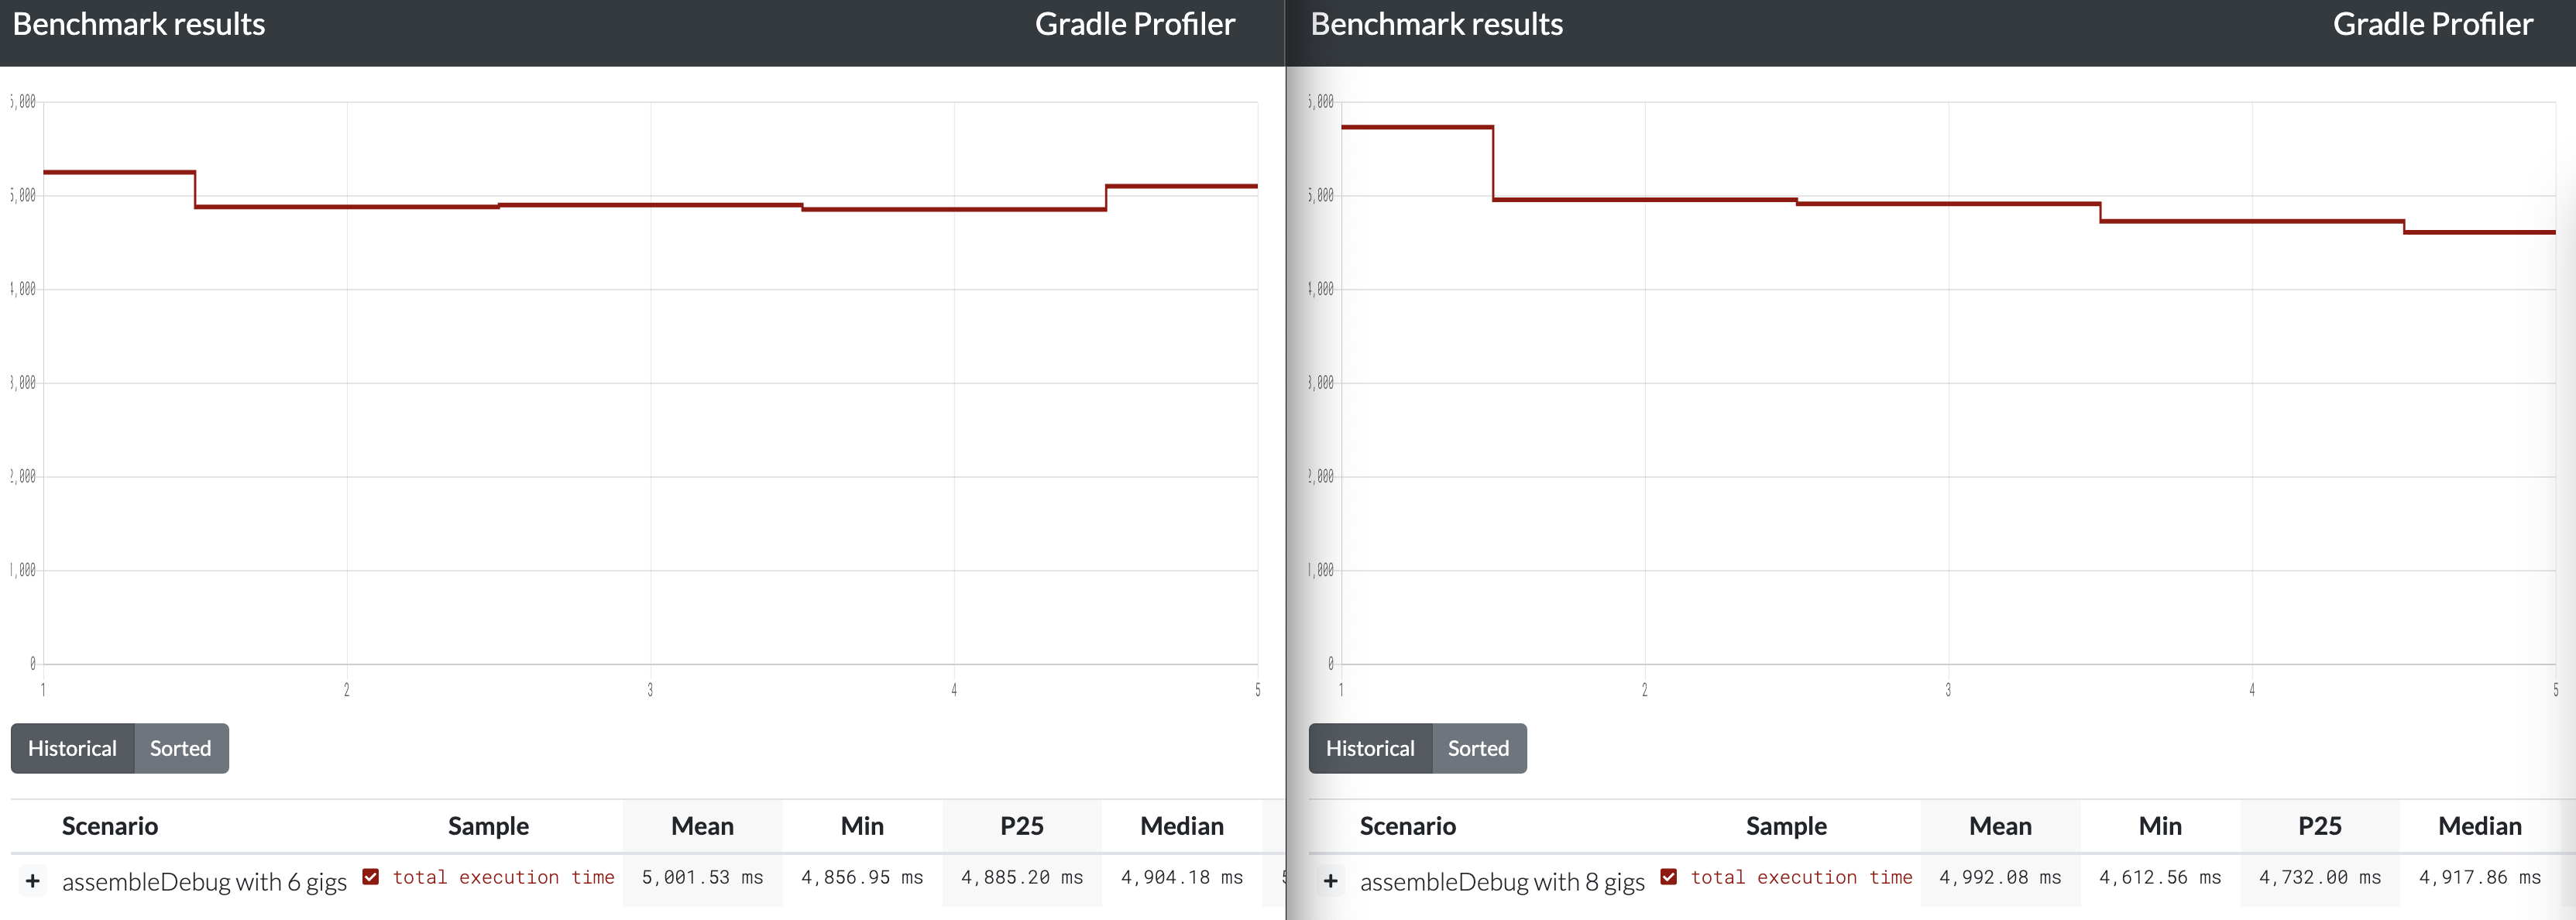
We can see that when we compare the results between using 6 gigs and 8 gigs, there isn't a ton of difference in mean execution time across the five iterations. That's okay though! Now we know! Increasing past 6 gigs for the Now In Android project doesn't give us much benefit.
In this post, we've shown you how to use Gradle Profiler to analyze your Gradle builds and identify bottlenecks that are slowing down your build times. By testing different scenarios, such as increasing the JVM args or switching to a different version of Gradle, you can optimize your builds and reduce your overall development time.
By taking the time to profile your builds with Gradle Profiler, you can save yourself a lot of frustration and make your development process smoother and more efficient. So give it a try, and see how much time you can save!